![]()
![]()
|
|
|
|
Click Here to Contact Dan Andresen
The purpose of this webpage is to describe in detail a math question that we are attempting to solve. Below we will describe the question as well as some required parameters that must be adhered to. The Bottom Line to our problem is :
We are trying to take a simple, un-weighted moving average
and Our problem is almost perfectly described in what is known as the Secretary Problem (and/or other, similar Optimal Stopping problems).
DETAILS OF THE QUESTION
The following is an detailed explanation of the math question we have:
1) We have a long series of computer generated numbers or "data points" (over 20,000 data points displayed in this sample).
2) We take that long series of numbers and split it into groups of 10 data points.
3) This is the first Group of 10 Data Points. This first Group will be used in the explanations below.
4) The first Group of 10 Data Points has an Average value of 7330.6
5) In the picture below, the Group's average of 7330.6 is being calculated at each Data Point. The Average uses a "Weight" of 1 on each Data Point (shown in the Green "1") creating an Un-weighted Average. By the 10th data Point, the average of all 10 Data Points is 7330.6
6) This chart shows that by applying DIFFERENT WEIGHTS to each Data Point, you can manipulate the Weighted Average to be lower. The Red "Weights" vary from 0 (on the 2nd Data Point) to 3 (on the 5th Data Point), creating a Weighted Average. By the 10th data Point, the average of all 10 Data Points is 7326.4 (which is lower than the Un-weighted Average of 7330.6 by 3.8 points).
Our goal is to find a way to calculate the AMOUNT
OF WEIGHTS to be placed at any given data point in order
ADDITIONAL REQUIREMENTS
Below are some requirements that the formula must take in to account. A) These numbers are generated 1 at a time. You do
not know what any of the future numbers are. B) You can place any number of weights on any Data Point, but you must have placed all 10 Weights on or by the 10th and final Data Point. C) The ultimate goal is for the Overall Weighted
Average to be lower than the Overall Un-weighted Average by at least 1 point.
WHAT WE NEED
We need a mathematical formula to determine how much Weight to apply at any given Data Point, with the ultimate goal of this formula producing results such that: The Overall Weighted Average must be 1 full point less than the Overall Un-weighted Average.
sample of hypothetical results data
The Purpose of this Sample Hypothetical Results Example is to show that the Results of the Math Formula are deemed "successful" or not (i.e. was the Overall Weighted Average 1 full point less than the Overall Un-weighted Average). This table below shows a format in which you can display your Output/Results.
Column A shows the Un-weighted Average of each Group of 10 Data Points. Column B is where a Math Formula was used to place different weightings on each of the 10 Data Points with the result being a Weighted Average. Column C is the difference between the Un-weighted Average and the Math Formula's Weighted Average.
The ultimate goal is for the Overall Weighted Average to be lower than the Overall Un-weighted Average by at least 1 point, as shown in the Results Chart above.
ALTERNATIVE RULES
1) You can use a different number of Data Points in a Group. You may define a Group as either 5, 10 or 15 Data Points; no more than 15 Data Points in a group is permitted. In any case, a Group of N Data Points has to have placed a total of N "weights" by the end of the Group. When one Group ends, the very next Data Point is the first Data Point of the next Group -- no skipping data Points in between Groups. 2) You may choose varying lengths of Data Points to call a "Group". For example, you may have Group of 5, then a Group of 3, then a group of 12, followed by a Group of 15, then a Group of 6. Group length can't be more than 15 in any case. In any case, a Group of N Data Points has to have placed a total of N "weights" by the end of the Group. When one Group ends, the very next Data Point is the first Data Point of the next Group -- no skipping data Points in between Groups. 3) Weights can be smaller than 1 unit. The smallest unit is 1/2 of 1. 4) A Weight can be a negative number as well, as long as the maximum weights placed is equal to the number of Data Points and by the final Data Point, you have placed all N weights. For example, if you have 10 as your number of Data Points, at the 10th Data Point, you have to have placed all 10 weights. Also, at any given point along the way you can placed as many weights as you want, but you can't be more than +10 or -10 overall at any time. Example on a 10-Data Point Group:
By the 10th Data Point... you have placed exactly 10 weights.
POSSIBLE FACTORS TO CONSIDER
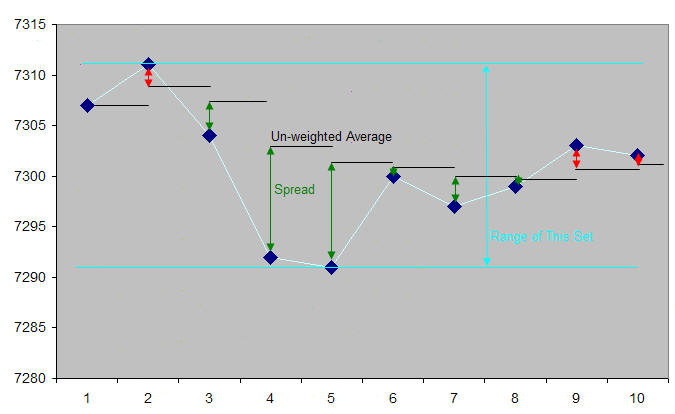
Here's an example of factors that we feel would likely be useful in creating a formula to determine the number of Weights to place on any given Data Point. THESE ARE MERELY SUGGESTIONS -- THIS MAY OR MAY NOT BE THE BEST APPROACH TO THIS PROBLEM. The chart below shows the Un-weighted Average, the Spread (distance between a given Data Point and that Un-weighted Average), and the Range of the 10-Data point set (distance from Highest Data Point to the Lowest Data Point). Using these factors (and perhaps prior Data / Averages / Spreads / Ranges / etc), it should be possible to create a formula that can, on any given Data Point, combine this information and determine how many Weights to place ("should THIS Data Point carry EXTRA Weights or should it carry normal weighting or do the factors suggest it carry FEWER Weights").
Factors that will likely be part of a formula:
Here is the actual data used in the chart above.
SAMPLE DATA
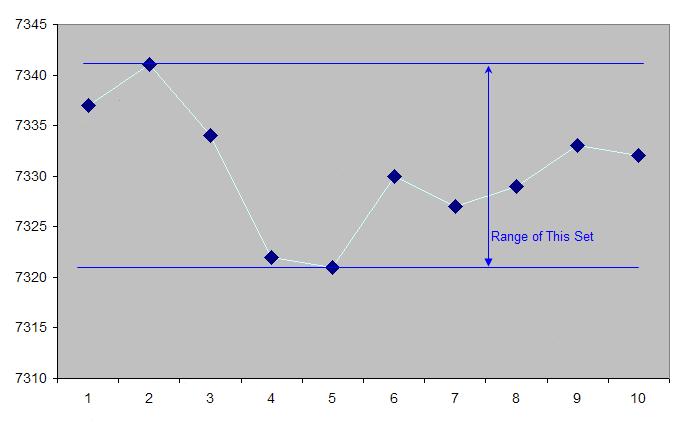
Listed below are several sets of sample data. The data samples differ mainly in their "ranges" (the numbers vary to a wider degree within each set of 10, as seen in the picture below).
Data Sets #1a, 1b and 1c are the preferred sets to use. The reason we are including the other data sets is that if the objective (of lowering the overall average down by 1 full point) can't be obtained using Data Sets #1a/b/c, then the other data sets may make it easier to accomplish the objective.
The following 3 Data Sets are the Preferred Data Sets to use -- they have the smallest "range" and most number of Data Points. Click Here for Sample Data #1a File Click Here for Sample Data #1b File Click Here for Sample Data #1c File
Here are some Alternative Data Sets: Click Here for Sample Data #2 File (The second best Data Set choice -- it has a slightly wider "range" and somewhat fewer number of Data Points than Data Set #1). Click Here for Sample Data #3 File (The third best Data Set choice -- it has a slightly wider "range" and somewhat fewer number of Data Points than Data Set #2). Click Here for Sample Data #4 File (The fourth best Data Set choice -- it has a slightly wider "range" and somewhat fewer number of Data Points than Data Set #3).
There are additional samples available of each of the Data Sets if you need/want more data (just email or call us and we'll provide more).
Click Here to Contact Dan Andresen
| ||||||||||||||||||||||||||||||||||||||||||||||||||||||||||||||||||||||||||||||||||||||||||||||||||||||||||||||||||||||||||||||||||||||||||||||||||||||||||||||||||||||||||||||||||||||||||||||||||||||||||||||||||||||||||||||||||||||||||||||||||||||||||||||||||||||||||||||||||||||||||||||||||||||||||||||||||||||||||||||||||||||||||||||||||||||||||||||||||||||||||||||||||||||||||||||||||||||||||||||||||||||||||||||||||||||||||||||||||||||||||||||||||||||||||||||||||||||||||||||||||||||||||||||||||||||||||||||||||||||||||||||||||||||||||||||||||||||||||||||||||||||||||||||||||||||||||||||||||||||||||||||||||||||||||||||||||||
"EasyTracking" is a trademark of Dynamic Design Software. All
other products mentioned are registered trademarks or trademarks of their
respective companies.
|